Introduction
In the realm of credit risk management, looking at a portfolio as a single, homogenous entity is a dangerous oversimplification. While high-level metrics like total exposure or average days late are useful, they hide the underlying dynamics of how different groups of customers actually behave.
This is where unsupervised machine learning, specifically K-Means Clustering, becomes an invaluable tool for credit managers. By clustering a portfolio, we move away from static, rule-based segmentation and instead group customers by their actual, multidimensional payment behavior and risk profiles.
How It Helps Manage Credit Risk
K-Means clustering automatically groups customers who share similar traits. In our model, we fed the algorithm four key dimensions:
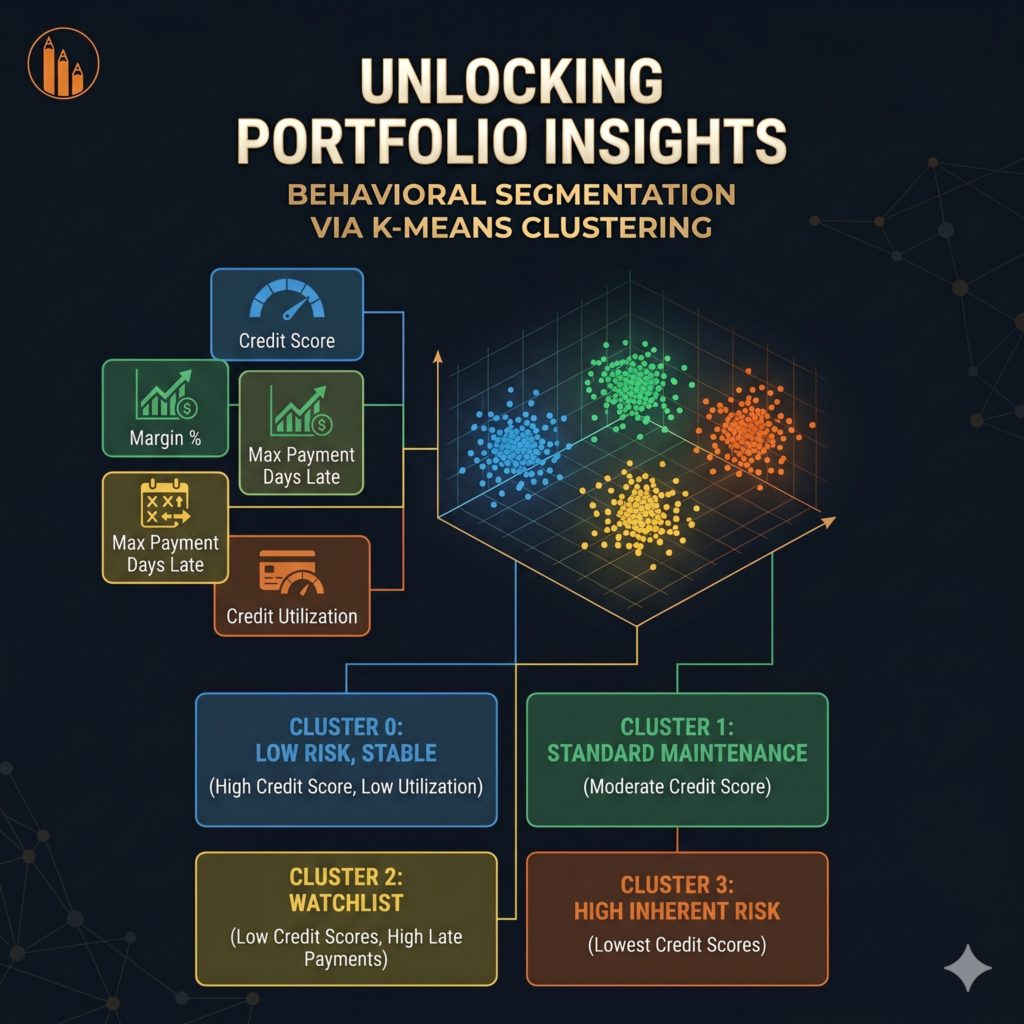
- 1. Credit Score: The baseline risk rating.
- 2. Margin %: The profitability of the customer.
- 3. Max Payment Days Late: A proxy for historical collection difficulty.
- 4. Credit Utilization: How much of their approved limit they are actively using.
By analyzing these features simultaneously, the algorithm identifies “hidden” risk pockets that standard reporting might overlook.
The Outcome & Insights
Applying this to our portfolio, the K-Means algorithm successfully identified 4 distinct behavioral clusters.
Cluster 0: High Credit Score (~84), strong margins, and low credit utilization (~16%). This is our “Low Risk, Stable” segment.
Cluster 1: Moderate Credit Score (~68), but slightly lower margins and higher utilization. This is our “Standard Maintenance” segment.
Cluster 2: The “Watchlist” segment. These customers have lower credit scores, the highest credit utilization (~22%), and the highest volatility in late payments.
Cluster 3: The lowest credit scores (~54) but surprisingly stable utilization. This is our “High Inherent Risk, Low Exposure” segment.
Actionable Takeaway
With these clusters defined, we can immediately adjust our risk appetite. We might automatically grant credit limit increases to Cluster 0, while placing strict hard-stops on orders from Cluster 2 until their utilization drops. By managing at the cluster level, we maximize sales where it is safe and restrict exposure where the mathematical risk is highest.